


The English data on vaccines and mortality, revisited
by Alex Berenson Nov 28, 2021
Last Saturday morning I posted a short post with a very simple chart – two lines in all.
One line tracked the number of weekly deaths per 100,000 vaccinated people aged 10-59 in England. The other tracked the number of deaths per 100,000 unvaccinated people in England. The chart showed that vaccinated people in this age group were dying overall at a higher rate than unvaccinated people.
I’m never exactly sure which posts will “land” – gain traction and go viral. This chart landed. Hard. Someone wrote me that it broke the Internet. It didn’t break the Internet, only Kim Kardashian’s ass can break the Internet, but it has rocketed around ever since. It has been seen over 800,000 times on this page alone and many millions more in screenshots and Twitter posts elsewhere.
Clearly, the reason the chart has gained so much attention is that it quickly and simply provides a way for people who are concerned about the vaccines to provide apparent visual proof that they are increasing all-cause mortality – overall death rates.
The chart has also engendered a fierce backlash from the usual fact-checkers and vaccine fanatics who say it is – wait for it – “misinformation.” (To be clear, I didn’t actually create the chart, but I checked the underlying British government report to make sure it accurately represents the report’s figures. It does, as everyone agrees.)
The “fact-checkers” have two primary complaints about the chart.
The first is that the vaccinated and unvaccinated groups are not exactly the same. A smaller percentage of teenagers than fifty-somethings are vaccinated, so the unvaccinated group overall skews somewhat younger than the older group. Since death rates rise with age, that difference may be enough to explain the gap between the two groups.
The second is that overall death rates in people over 60 (who are not covered in the chart) are much higher than those in the 10-59 range and appear to be lower in the vaccinated over the unvaccinated.
Another way to look at the objections: the first is that the chart doesn’t say what it seems to say, because of a hidden flaw in the data. The second is that it would be basically meaningless even if it did, because other more robust datasets contradict it.
Part of being on Team Reality is acknowledging reality, and acknowledging when your critics have a factually correct objection. So I want to acknowledge that, like the chart itself, these objections BOTH are valid and factually accurate, viewed individually.
What the fact-checkers and vaccine fanatics appear incapable of understanding is that the two objections effectively cancel each other out – and do nothing to address concerns over the long-term failure of Covid vaccines or their impact on all-cause mortality.
These folks think they are sophisticated thinkers who have blown up apparent evidence that the vaccines are dangerous. In fact, just as they have for the last several months, they are telling themselves what they want to hear instead of listening to what the data are saying – and, increasingly, shouting.
They have identified and latched on to ONE complication of using population-level data to judge vaccine effectiveness – the fact that differing rates of uptake by age may make the Covid vaccines seem less effective than they are.
But they – deliberately or out of ignorance – are ignoring another one, one that makes the vaccines seem MORE effective than they are.
The second problem is not a secret to epidemiologists.
It has been quietly discussed for flu vaccines for more than a decade, and I have written about it repeatedly in the last year. The problem is this: the popular belief that sick people are more likely to be vaccinated than healthy people is entirely wrong.
People who receive vaccines are healthier overall than those who do not. They care more about avoiding sickness, and they have the time and energy and money to find their way to a vaccination site. They are not healthier because they get vaccines; they get vaccines because they are healthier.
Older people who receive flu vaccines die – of both the flu and all causes – at much lower rates than unvaccinated people after they receive flu shots. But they also die at much lower rates BEFORE they receive the vaccines. The seminal study demonstrating this relationship is now more than 15 years old; it was published in the International Journal of Epidemiology in April 2006.
“The reductions in risk before influenza season indicate preferential receipt of vaccine by relatively healthy seniors,” the authors wrote.
This paradox helps explain why a huge study of flu vaccines in the United Kingdom showed that increasing vaccination levels in older people did not reduce to the number of hospitalizations or deaths from the flu.
The researchers took advantage of the fact that Britain prioritizes people 65 and older for vaccinations and that people are much more likely to get a shot when they are 65 or 66 than 64 or 63. Vaccination levels rose sharply as people turned 65, but the health of the people who received the shots did not improve.
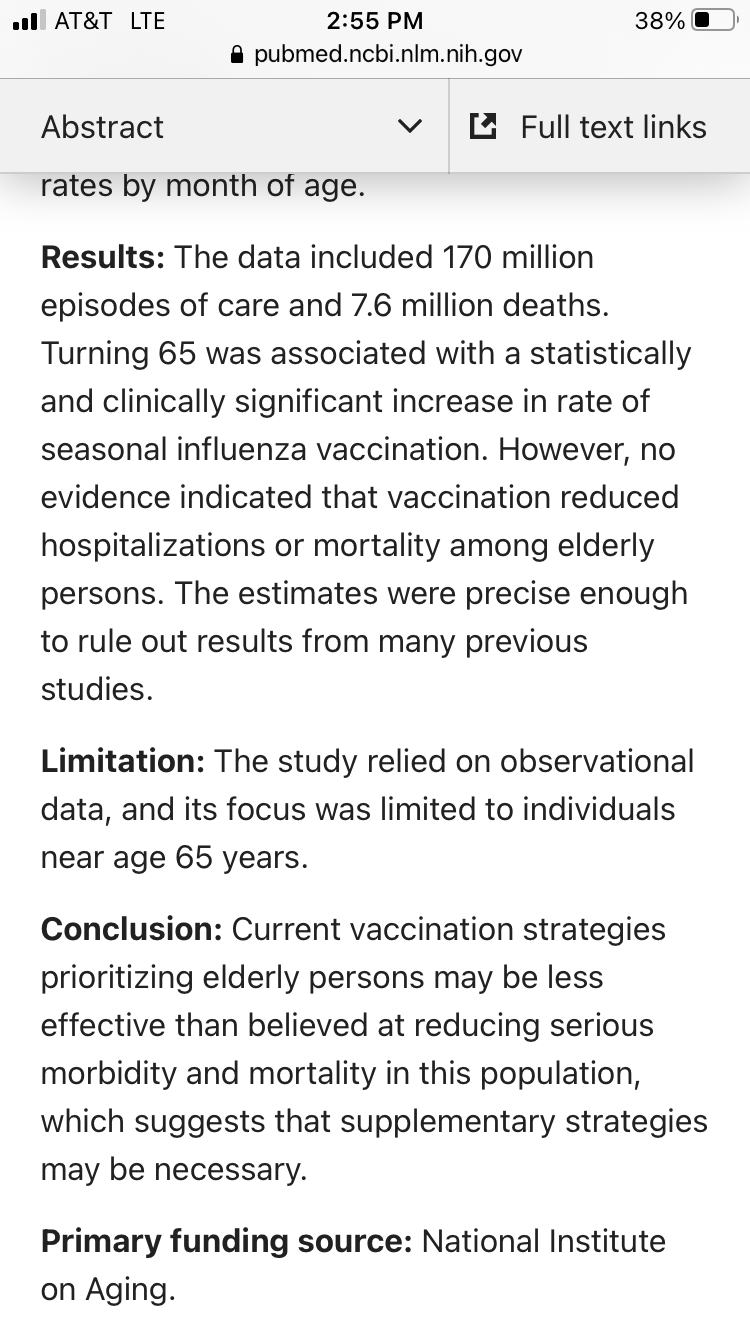
The same pattern is visible in the United States, where a massive increase in the number of flu vaccines in the last generation has made no apparent difference in the number of flu deaths. In fact, in 2005, researchers noted that although vaccinations had risen from 20 percent of elderly people in 1980 to 65 percent in 2001, “unexpectedly, estimates of influenza-related mortality in this age group also increased [emphasis added] during this period.”
(SOURCE: https://pubmed.ncbi.nlm.nih.gov/15710788/)
In other words, influenza vaccines only seem to work. Any observational estimate that compares death rates in people who have gotten shots to those who have not will be inherently untrustworthy, no matter how hard researchers try to correct for the healthy recipient bias.
What is true for flu vaccines appears to be even more true for Covid vaccines.
The relentless vaccination push means that in many countries, more than 90 percent of elderly people are vaccinated. The split is even more stark in countries like England, where 2.44 million people 80 and over have been fully vaccinated, compared to 69,000 who are unvaccinated (and 24,000 who have received the first dose but not the second).
Look at those numbers again.
2,440,000 people in England 80 and over vaccinated. Almost 97 percent of the total number of elderly people.
69,000 80 and over unvaccinated. Less than 3 percent.
These two groups cannot remotely be compared.
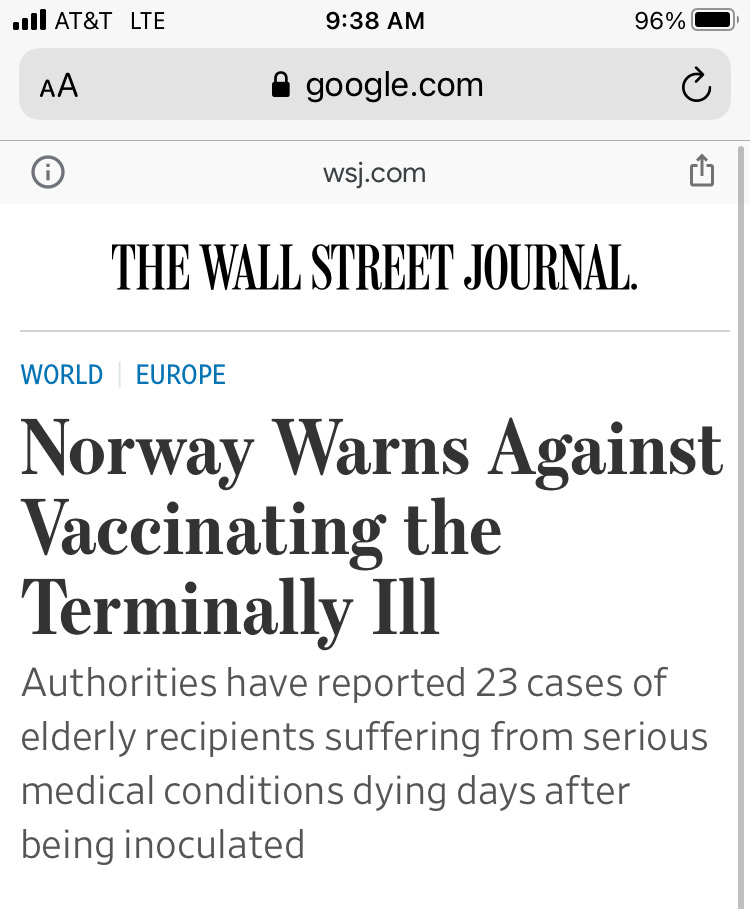
How do they differ? I can’t find any hard data, but we know that at least a fraction of the elderly unvaccinated are too ill to be vaccinated. Some are in hospice care. Norway recommended against giving people in hospice the Covid vaccine in January following deaths in terminally ill patients.
A paper published online in March in the Journal of Pain and Symptom Management noted that “communication from hospice organizations has primarily emphasized the vaccination of hospice staff without the same priority mention for patients” and called for hospices to do more to offer vaccines to patients.
The paper’s title was even starker:
A Shot at Inclusion: Reconsidering Categorical Exclusion of Hospice Patients from COVID Vaccine Allocation.
How many Covid deaths in unvaccinated elderly people are actually “with Covid” deaths in people dying in hospice? Again, we don’t know. But what we know is that even a small number of those deaths will hopelessly bias the relative risk ratio for unvaccinated to vaccinated Covid deaths, because the overall number of unvaccinated people is so small.
As of September, about 30 to 35 unvaccinated English people 80 and over died of or with Covid each week, compared to about 250 fully vaccinated people a week.
So trying to measure vaccine effectiveness by looking at the relative risks of the vaccinated and unvaccinated elderly is impossible. But that is exactly what the health authorities and their servants in the media do when they put out figures that seem to show the risk of death from Covid is much lower in elderly people who have been vaccinated.
They are lying with truthful data, and they (some of them, anyway, though probably not the reporters who are writing the stories) are smart enough to know exactly what they’re doing.
Meanwhile, they are ignoring a much more important indicator – trends in both Covid and all-cause mortality are very much going the wrong way in the vaccinated elderly population.
In the last four weeks for which British data are available, roughly coinciding with September, about 1,000 vaccinated English people 80 and over died from Covid and 16,000 from all causes.
Compare those numbers to four weeks in May, when fewer than 70 vaccinated English people 80 and over died from Covid and 13,000 from all causes.
Put another way, overall deaths rose more than 20 percent in the vaccinated elderly from May to September, and Covid deaths 15-fold. And this was not because many more people were vaccinated. The number of vaccinated elderly people rose only about 4 percent from May to September.
Compare that to the mortality trends in unvaccinated English people 80 and over.
About 800 died of all causes in four weeks in May (at the time, there were about 77,000 unvaccinated elderly people, compared to 69,000 in September). Fewer than 20 of those died of Covid.
In September, about 140 unvaccinated elderly people died of Covid – a eight-fold increase compared to the 15-fold increase in the vaccinated.
(All data from the British government:
See tables 3 and 4 in downloaded file.)
But that difference isn’t the striking part.
The striking part is that only 700 unvaccinated elderly English people died OF ALL CAUSES in those four weeks in September – FEWER than back in May. (The trend roughly tracked the overall drop in the elderly unvaccinated population. It appears that about 1 percent of those folks die a month, at least in warmer months.)
This trend is stunning for two reasons.
First, the fact that 100 more unvaccinated elderly people (supposedly) died of Covid in September yet 100 fewer of them died overall strongly suggests that many of those reported deaths are actually with and not from Covid.
Second, per capita all-cause mortality – not just Covid mortality, all-cause mortality – rose close to 20 percent in the very large group of the vaccinated elderly. Some of those extra deaths came from Covid. But most did not.
And though death rates are still somewhat higher in the unvaccinated – as they should be, given the fact that vaccine recipients are healthier – but that fact is far less relevant than the notable rise in the vaccinated.
What’s behind the rise in those deaths in the vaccinated elderly? We don’t know. But we’d better find out. Especially since we are now stuffing boosters into their arms.
All of this is somewhat complicated, I’ll admit. The data has lots of confounders and continues to evolve. And trying to explain relative changes in all-cause mortality in the context of healthy vaccine recipient bias using papers about flu vaccine – well, it’s not a soundbite.
Which comes back to the chart from last week.
The chart IS a soundbite.
It is a simple and factually accurate way to say:
Something is wrong. The promises that the health authorities have made over the last 12 months about the vaccines are not coming true. Despite near-complete levels of adult vaccination in Europe, many countries are seeing skyrocketing Covid cases and deaths. And worst of all, all-cause non-Covid mortality is running well above normal in country after country.
Not everyone is going to wade through this article. But everyone can read that chart from last week. It’s not perfect, but it uses real data to raise a crucial issue.
That’s why it landed. And that’s why the vaccine fanatics hate it so much.


0 Comments