
Farmer on a tractor with a sprayer makes fertilizer for young vegetables
Big Farms, Empty Food, Chronic Disease
Modern agriculture has made food plentiful and abundant—but not healthy.
Half of the American population have chronic diseases, utilizing 86 percent of health care dollars. Oftentimes the blame is placed on those who are ill for their lifestyle choices. But the numbers tell a different story: as small farmers started getting squeezed out of food production and agriculture became dominated by a smaller number of huge agribusinesses, the quality of our food dropped precipitously. Less nutritious food meant Americans weren’t getting the nutrients they need, which has helped create an epidemic of chronic disease. Tackling the chronic disease epidemic isn’t only about adjusting individual choices, but also about attacking the cronyism at the root of our food policy that degrades our food, our health, and the planet.
Americans are deficient in many key nutrients
The following percentages of Americans do not meet government benchmarks for the corresponding nutrients:
| Nutrient | Percent of Americans Below Estimated Average Requirement (EAR*) |
| Calcium | 42.91 |
| Magnesium | 53.46 |
| Vitamin A | 45.21 |
| Vitamin D | 94.90 |
| Vitamin E | 83.70 |
| Vitamin C | 45.92 |
*EAR is the amount of a nutrient that is estimated to meet the requirement for a specific criterion of adequacy of half of the healthy individuals of a specific age, sex, and life-stage.
Why are we nutrient deficient? The nutrient levels in food have decreased markedly over the years.
Consider the following charts showing the nutrient content of our food plummet when industrial agriculture started becoming the dominant way food was grown.
Selected Nutrients in 100g Broccoli
| Nutrient | 1975 | 1997 | Change |
| Calcium | 103 mg | 48 mg | Down 53.4% |
| Iron | 1.1 mg | 0.88 mg | Down 20% |
| Vitamin A | 2500 IU | 1542 IU | Down 38.3% |
| Vitamin C | 113 mg | 93.2 mg | Down 17.5% |
| Thiamin | 0.10 mg | 0.07 mg | Down 35% |
| Riboflavin | 0.23 mg | 0.12 mg | Down 47.8% |
| Niacin | 0.9 mg | 0.64 mg | Down 28.9% |
Vitamin A Levels in Selected Garden Vegetables, per 100g
| Vegetable | 1975 | 1997 | Change |
| Broccoli | 2500 IU | 1543 IU | Down 38.3% |
| Cabbage | 130 IU | 133 IU | Up 2.3% |
| Carrots | 11,000 IU | 28,129 IU | Up 155.7% |
| Cauliflower | 60 IU | 19 IU | Down 68.3% |
| Collard Greens | 6500 IU | 3824 IU | Down 41.2% |
| Daikon | 10 IU | 0 | Down 100% |
| Kale | 8900 IU | 8900 IU | None |
| Mustard Greens | 7000 IU | 5300 IU | Down 24.3% |
| Onions | 40 IU | 0 | Down 100% |
| Parsley | 8500 IU | 5200 IU | Down 38.8% |
| Turnips | 7600 IU | 7600 IU | None |
| Watercress | 4900 IU | 4700 IU | Down 4.1% |
| Net Change | Down 21.4% |
Vitamin C Levels in Selected Garden Vegetables, mg per 100g
| Vegetable | 1975 | 1997 | Change |
| Broccoli | 113 | 93.2 | Down 17.5% |
| Cabbage | 47 | 32.2 | Down 31.9% |
| Carrots | 8 | 9.3 | Up 16.3% |
| Cauliflower | 78 | 46.4 | Down 40.5% |
| Collard Greens | 92 | 35.3 | Down 61.6% |
| Daikon | 32 | 22 | Down 31.3% |
| Kale | 125 | 120 | Down 4% |
| Mustard Greens | 97 | 70 | Down 27.8% |
| Onions | 10 | 6.4 | Down 36% |
| Parsley | 172 | 133 | Down 22.7% |
| Turnips | 139 | 60 | Down 56.8% |
| Watercress | 79 | 43 | Down 45.6% |
| Net Change | Down 29.9% |
Calcium Levels in Selected Garden Vegetables, mg per 100g
| Vegetable | 1975 | 1997 | Change |
| Broccoli | 103 | 48 | Down 53.4% |
| Cabbage | 49 | 47 | Down 4.1% |
| Carrots | 37 | 27 | Down 27% |
| Cauliflower | 25 | 22 | Down 12% |
| Collard Greens | 203 | 145 | Down 28.6% |
| Daikon | 35 | 27 | Down 22.9% |
| Kale | 179 | 135 | Down 24.6% |
| Mustard Greens | 83 | 103 | Down 43.7% |
| Onions | 27 | 20 | Down 25.9% |
| Parsley | 203 | 138 | Down 32% |
| Turnips | 246 | 190 | Down 22.8% |
| Watercress | 151 | 120 | Down 20.5% |
| Net Change | Down 26.5% |
Chart source: Alex Jack, America’s Vanishing Nutrients: Decline in Fruit and Vegetable Quality Poses Serious Health and Environmental Risks
We reported recently on another analysis concluding that you would need to eat eight oranges today to get the same amount of vitamin A as our grandparents would have gotten from one.
Industrialized agriculture the cause of nutrient decline
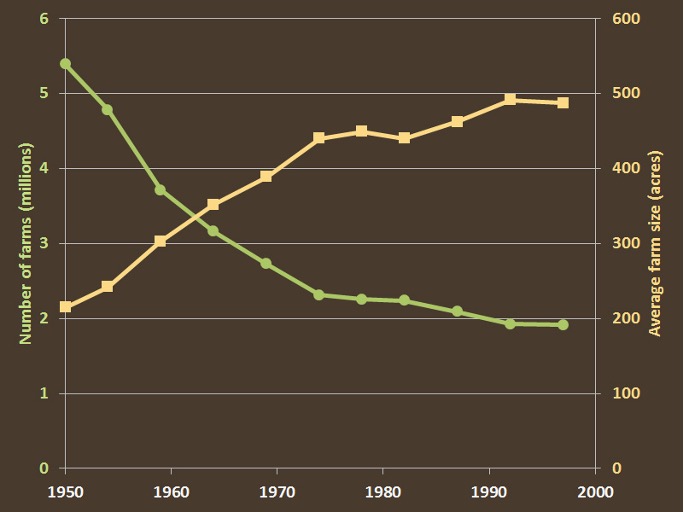
The statistics above roughly correlate with the advent of industrialized agriculture. The chart below shows that the number of farms in the US decreased by 64.5% between 1950 and 1997, and the average farm size more than doubled.
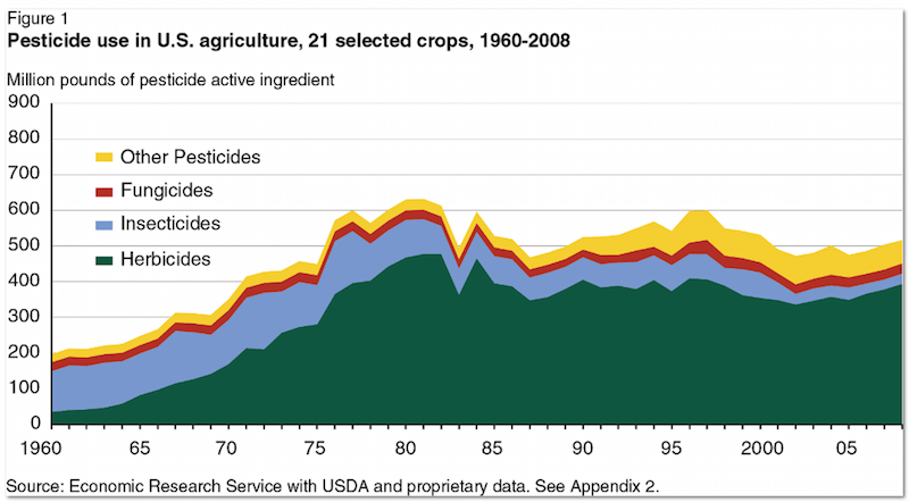
Industrial farms are predominately monoculture, meaning they produce a single crop year after year. Corn and wheat absorb different minerals from the soil. Traditional farming understood this fact and rotated crops to avoid depletion. Industrial farms do not practice crop rotation, but instead rely on chemical inputs in the form of fertilizers and pesticides. Pesticide use increased 222% between 1960 and 1981, then decreased 18% from 1981 to 2008. But the damage had been done to our food. Pesticides damage the organisms that live in soil, which are crucial to the soil’s health and, of course, the plants that grow in the soil. Chemical fertilizers make plants grow faster and bigger, but not healthier.

This matters because a lack of nutrients in our food is making us sicker.
These trends correlate to chronic disease trends. Both obesity and diabetes have increased precipitously over time. The CDC estimates that diabetes rates increased 8-fold between 1958 and 2015. These rates have continued to increase in recent years. Obesity rates have also increased progressively over the last five decades: incidence rates of overweight have increased two-fold since the 1950’s and obesity rates have increased 3-fold. Today, 42 percent of US adults are obese. Part of the problem is the US’s heavy subsidization of crops used to make cheap junk food. People eat more and more while getting less nutrition from their food.
Other chronic diseases like coronary heart disease (CHD) and cancer have decreased over time, but this is misleading. Significant decreases in the percentage of Americans who regularly smoke cigarettes help explain a large portion of this trend. Between 1981 and 2000 CHD mortality decreased by half; the decline in smoking prevalence is estimated to explain about 43 percent of that decrease. Smoking is known to cause cancer, heart disease, stroke, lung disease, diabetes, chronic obstructive pulmonary disease, and immune problems.
Lack of micronutrients is linked with chronic disease.
Not getting the nutrients we need is priming many of us for chronic ailments.
- Lack of vitamin D is linked with diabetes, cardiovascular disease, hypertension, and heart failure.
- Studies show that individuals with higher vitamin C intake have a lower risk of a number of chronic diseases including heart disease, cancer, eye diseases, and neurodegenerative conditions.
- Vitamin A deficiency impairs our immune system.
- Low folate and other B vitamin intake is associated with increased risk of CHD.
- Vitamin E and lycopene decrease cancer risk.
- Vitamin D and calcium decrease occurrence of fractures.
It is our poor diet and food grown in nutrient depleted soil, in addition to our exposure to chemical toxins and pollutants, that has helped create an epidemic of chronic disease. Our healthcare system is overburdened trying to address these chronic ailments with pharmaceutical drugs that are dangerous, expensive, and often don’t work. At the same time, our food system relies on dangerous chemicals that degrade human health and prioritizes subsidizing mono crops like corn and wheat with low nutritional value. We need to shift to a regenerative approach to human health as well as agriculture. This means reducing toxic inputs into our soil, water and air, and increasing the availability of nutrient-dense foods. Healthy food can support a regenerative approach to healthcare where diet, proper supplementation, and the avoidance of toxins and pollutants address key sources of our chronic disease epidemic. Until we make this transition, we will continue to pay more and more for healthcare that doesn’t optimize our health.


0 Comments